
Data centers' heat exhaust is not raising the land temperature around where they're built
A terrible paper and even worse interpretation is threatening to become common wisdom

Wildly misleading stories about data center environmental impacts can just pop up out of nowhere, be shared a ton, and become embedded in the common wisdom of educated people, despite being completely wrong. This happened with the claim that AI uses a bottle of water per prompt, and that normal operations of data centers are causing the people around them to lose access to water.
I’m writing this as an emergency post because a new contender for drastically wrong common wisdom has just popped up.
There’s a new paper being shared and reported on called “The data heat island effect: quantifying the impact of AI data centers in a warming world.” It is the single worst writing and research on AI and the environment that I have read.
The central claim of the paper is that in the places where data centers are built, land surface temperatures increase by an average of 2°C (3.6°F) after the data center begins operations, creating what the authors call a “data heat island effect” that affects over 340 million people worldwide. In some extreme cases, data centers are found to increase land surface temperature by up to 9°C (16°F). The paper claims that a warming effect can be measured up to 10 km from the data center. This all sounds really bad! 340 million people affected by heat islands.
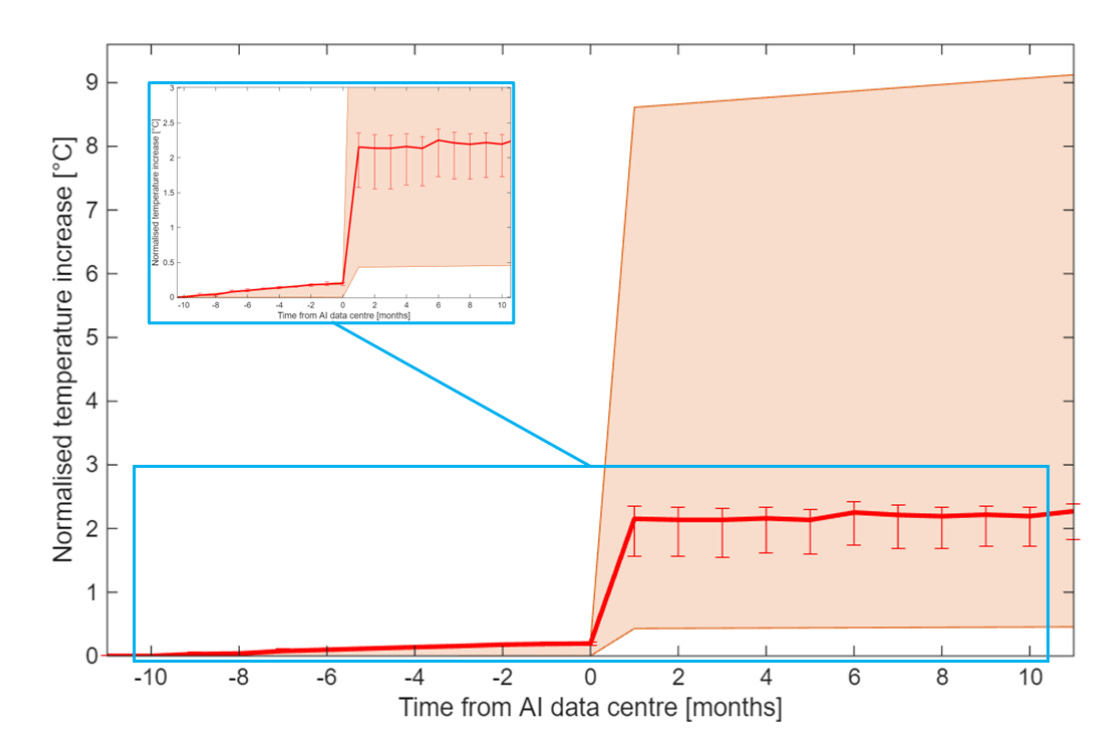
The paper also has alarming looking graphs that I suspect will do well in the media coverage:

There are three problems with this paper:
The methodology is completely off-the-wall goofy and the study does not at all show what the authors claim. This will be the focus of this post. The authors very strongly imply this temperature change is due to data center waste heat, but I think it’s almost certain that it’s instead entirely due to the fact that the surface of any building, a data center or Wal Mart or house or Starbucks, is hotter than the grass that was there before. I think I can show conclusively using high school physics and math that the data centers are not heating the land around them. Data center heat exhaust could only heat land by at most 1% of what the authors imply. The paper itself doesn’t even consider this very obvious reading as a possibility.
The paper’s framing is wildly misleading and will create a lot of additional confusion on top of the methodology itself being bad. The author’s suggestions from this paper is to “build more energy efficient AI algorithms” but the actual conclusion should be “Don’t build buildings if you don’t want those buildings themselves to get a little warm, even though they won’t affect anything around them.” There is a lot more incredibly shifty language the authors use over and over.
I’m worried that the media takeaway from this is going to be that data centers are warming the air this much. If they were, that would be a complete disaster. To put this in context, if (another) data center were built near me in DC, and it heated the air by an average of 9°C, this would change the DC climate to the climate of Miami. A 2°C would be equivalent to moving DC halfway to Georgia, it would be like the region had fast forwarded through 50-70 years of climate change. In reality, the data centers are being measured to warm the land around them, which is very very different (explained below). It seems likely that a lot of people will misinterpret this. Look again at the graphs from the paper. The Y axes say “Normalised temperature increase,” not “Normalised land temperature increase” and if they’re shared without context, I suspect people will draw the wrong conclusions.
Contents
The paper
A summary of my argument
The measurements in this paper are just showing the fact that buildings are hotter to the touch than grass. The data centers are most likely not heating the land around them. They themselves are just hot because they are buildings. If you include hot buildings in a very general measurement of the average total surface temperature of a large area, that average will go up slightly without telling you anything about the undeveloped land.
Using simple high school physics, it’s easy to show that there is no way data center heat exhaust could account for more than at absolute most 3% of the observed average land heating, and any realistic assumptions drive that down to basically 0. The only other mechanism by which they could be heating the land fails. This leaves the other explanation: the data centers themselves are hot because they are buildings, the land around them remains at the same temperature, unless more buildings have been built on top of it to accommodate the data center.
You would think the authors would have anticipated my criticism, but they don’t even consider it as an issue with their methodology at all.
What is land temperature?
NASA defines land surface temperature (LST) this way:
Land surface temperature is how hot the “surface” of the Earth would feel to the touch in a particular location. From a satellite’s point of view, the “surface” is whatever it sees when it looks through the atmosphere to the ground. It could be snow and ice, the grass on a lawn, the roof of a building, or the leaves in the canopy of a forest.
We need to understand land temperature as opposed to air temperature. They can be very different from each other. An obvious example is stepping onto black asphalt on a summer day. Even though the air temperature may be warm, if the air were as warm as the asphalt you’d be dead. Stepping onto a light-colored concrete sidewalk instead would be much more cool. Land temperatures can deviate a lot from the temperature of the air.
Changes in land temperature of 2-9°C don’t really impact human welfare directly. What matters for human welfare is air temperature. This temperature range invokes the low to very extreme catastrophic ends of the spectrum of what could happen with climate change, but that spectrum is about air temperature. Land temperatures change all the time without a corresponding significant effect on air temperature. If the most extreme land temperature changes happening in the paper were happening around you, the air around you would likely warm by a fraction of a degree at most. It would probably too small to measure or distinguish from normal day-to-day temperature variability.
How much does land temperature matter for the ecology of a region? Soil temperature directly affects plant health, microbial activity, moisture retention, and which organisms can survive in an area. If data centers really were warming the land surface by 1°C out to 4.5 km away, as the paper claims, that would be worth paying attention to ecologically even if it didn’t matter much for the people living nearby. A 1°C rise in soil temperature is pretty minor, but a 9°C would change which plants and microbes could survive. This would be a problem if it were real, but as I’ll try to show below, it’s not.
The methodology
The researchers used satellite data from NASA satellite sensors to measure land surface temperature at data center locations worldwide from 2004 to 2024. They looked at how land temperature changed at each site before and after the data center began running, and found a clear jump of about 2°C on average right at the moment the data center came online, as shown on this graph (the orange region shows the range from the very minimum to maximum measured temperature changes, the red line is the average, and the error bars represent the 95th percentile bounds, meaning the vast majority of measurements fell within those much smaller bounds):
The paper also claims that this effect extends up to 10 km from each data center, with a measurable 1°C land temperature increase as far as 4.5 km away using the same MODIS sensor:
The authors present this as evidence that data centers create broad climate zones comparable to urban heat islands.
The authors are somewhat ambiguous about what’s causing this temperature increase. They say that their study “relies on the assumption that AI hyperscalers might have an impact on the LST of their locations because of the heat that they would release as a result of the high power demanding applications.” So this makes it sound like they mean to imply that it's the heat exhaust of the data centers (evaporated water or from air cooling systems) that's causing this increase. However, they never explicitly state this, and they never consider the alternative explanation that the temperature increase is simply caused by the construction of the building itself. The possibility that replacing grass with a large building and parking lots might explain their results is completely absent.
Their mitigations section confirms what they think is going on, though. Their proposed solutions are all reducing operational energy use. They recommend more efficient AI algorithms, adiabatic circuits, and passive radiative cooling coatings for data center buildings. These are solutions to the problem of “servers produce too much heat” not “a building was built.” If the authors believed these numbers were primarily driven by land cover change, the solution would be “paint the roof white” or “plant vegetation around the perimeter.” Instead, they propose redesigning AI models themselves. This tells you they believe operational waste heat is the cause, even though their methodology can’t actually support that conclusion. But their methodology is goofy goober.
This is in some ways worse than if they’d made an explicit causal claim, because there’s nothing specific to argue against. The most obvious alternative explanation for their findings, that buildings are hotter than fields, isn’t mentioned in this paper. They don’t control for it as a possibility.
My core claim: this is literally just measuring hot surfaces of new buildings, and the soil and land around those new buildings probably hasn’t changed temperature at all
My argument here is going to be that this paper is just measuring the fact that buildings are hotter than grass. The land around the data center that isn’t either buildings or road has probably not warmed. It doesn’t matter at all that this study is about data centers. I’d expect similar measurements for Wal Marts.
If you build a building, whether it’s a data center or Wal Mart or house or Starbucks, and you point a NASA satellite at the building, you are going to measure a warmer surface temperature exclusively caused by the material the building made of, not any heat exhaust from what’s happening inside the building.
However, the difference between the surface temperature of buildings and grass is much larger than study’s finding of 2°C. It’s on the order of 20-35°C on a sunny day. Why is the study’s number so much smaller? The satellite sensors this study used (MODIS) can’t actually look at an area as small as a data center. MODIS pixels are roughly 1 km² (or 0.5 x 0.5 km in the enhanced product the paper claims to use). A data center and its parking lots might occupy a fraction of that pixel, with the rest still being undeveloped land, roads, or vegetation. So what the satellite sees is a blended average, maybe 10-20% data center and parking lot surface, and 80-90% unchanged land.
Let’s assume buildings and roads are on average 20°C warmer to the touch than grass. To get an average land temperature change of 9°C (the most extreme outlier in their data) on a 0.5 x 0.5 km unit of grass, you would need to build 112,500 m² of new building and road surface, about 28 acres. Many hyperscale data centers are larger than this. For example, QTS Atlanta's campus covers over 95 acres, DC BLOX's Atlanta West campus is 55 acres, and the Stargate campus in Michigan will occupy 250 acres. Even a typical hyperscale data center occupies around 10 acres of building footprint alone, before accounting for parking lots, substations, access roads, and security perimeters, which can easily double or triple the total paved surface. 28 acres is a mid-sized hyperscale campus. This on its own would explain the most extreme outliers.
What about the 2°C average they find? To get a 2°C increase, you would only need about 25,000 m², or roughly 6 acres of building and road surface within the satellite's field of view. That’s a pretty normal size for a non-hyperscale data center.
What about the increase in temperature farther from the data center, up to 10 km away? Well, two things:
Data centers are mostly not built in very isolated places. They need power infrastructure, fiber connectivity, and road access. Places with this stuff are also attractive for warehouses, logistics hubs, office parks, and residential development. When you look at the area within 10 km of a data center, you’re typically looking at a region that has a lot of new building in general, and that all registers as warmer to a satellite’s thermal sensor, regardless of what the buildings are used for. The paper’s smooth spatial decay curve is exactly what you’d expect from a development footprint that’s densest near the infrastructure hub and thins out with distance.
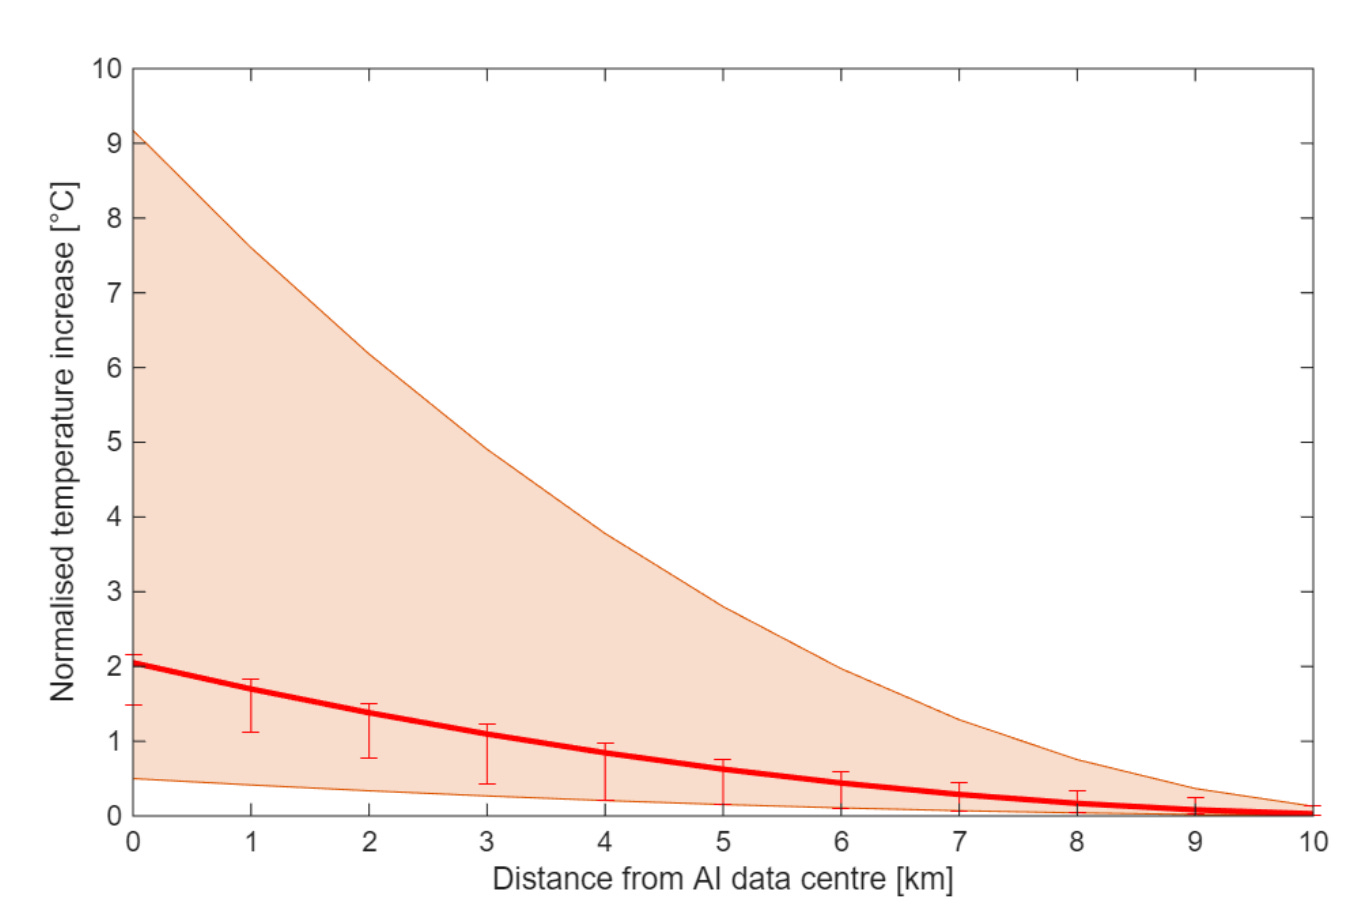
Importantly, this is not what you would expect if the effect were being driven mainly by waste heat from a single facility. Waste heat in air does not spread outward in a neat, slowly fading circle. It behaves more like a plume: it rises, mixes, and disperses through an ever larger volume of atmosphere, causing its temperature effect to fall off in a strongly nonlinear way with distance. The exact decay depends on wind, turbulence, exhaust height, and mixing conditions, so there’s no single universal graph here. But we know for sure that if this were really a direct waste-heat signal, you would expect a pronounced curved drop-off, not a broad, almost linear decline over many kilometers like what we actually see. The paper’s red line looks much more like a development gradient than a plume. A smooth, nearly linear decrease is exactly the sort of pattern you would expect if the land closest to the data center were also the land most likely to pick up new roads, roofs, parking lots, warehouses, and other warm impervious surfaces, with that development footprint thinning gradually as you move outward.
Data centers also frequently trigger or coincide with significant new infrastructure construction in the surrounding area. A hyperscale data center consuming 100 MW or more needs dedicated power infrastructure. These are large industrial installations with their own footprints built within a few kilometers of the data center they serve. Access roads also need to get built or widened. Fiber corridors are trenched. Supporting commercial services like equipment suppliers, security contractors, food service for construction crews and staff set up nearby. The data center brings an ecosystem of development with it. All of that replaces vegetation with built surfaces, and all of it would register as increased land surface temperature to a satellite, having nothing whatsoever to do with the thermal output of the servers.
The paper doesn’t control for any of this. They don’t compare their data center sites against other types of commercial construction. They don’t attempt to separate the surface change from operational heat output. They don’t even discuss the possibility that what they’re measuring is a land cover change rather than a thermal pollution effect. The entire paper treats the LST increase as if it were caused by the servers running inside the building, when the far more parsimonious explanation is that it was caused by the building itself. And if it is caused by the building itself, there’s no reason to expect the land around it to be heating at all, for 2 reasons:
Land mostly doesn’t absorb heat from nearby buildings. If you step from a hot asphalt parking lot into cool grass, that grass is likely the same temperature as grass a mile away from the asphalt.
If the land were heating up, this would imply that the buildings themselves would need to be much cooler to keep the average as low as it is. Data centers and the roads and infrastructure around them would need to be significantly cooler than all other normal buildings, or just be very small, and we know they’re not small.
There’s some very minor effects big buildings have with the flow of air and wind around the land around them, but it’s pretty marginal, and again this would change the study to be about any large buildings at all.
I think I already have a strong case here, but I have some high school physics and math in the next section that in my opinion completely confirms it.
How much could a data center’s waste heat raise the land temperature around it?
MODIS satellites take their measurements around 10:30 AM and 1:30 PM. During the day, the sun is shining directly on the ground. The ground absorbs solar radiation and gets hot. The air above it is cooler than the ground surface. This means heat is basically always flowing upward, from the ground into the air.
Data centers emit heat into the air. The the way they would heat the land is by raising the temperature of the air enough that less heat from the ground flows into the air, and stays in the ground instead. The colder the air, the more heat is lost from the ground, and the warmer the air, the more heat stays in the ground. It’s like if you touch an ice cube to your hand, and then touch a lukewarm object to your hand. In both cases, your hand is losing heat energy, but it loses it much faster when in contact with the ice cube.
How much would the data center need to heat the air to cause significant amounts of heat energy to stay in the ground?
The math (skip if you’d just like the conclusion)
MODIS is measuring land surface temperature. The graph in the study shows that over an area of 1.6 km, land temperatures were elevated by 1.5°C. Could a data center’s waste heat plausibly deliver enough extra heat to keep the surface around it about 1.5°C warmer over a radius of roughly 1.6 km?
Consider a large hyperscale data center drawing 100 MW of power. Nearly all of that electricity eventually becomes waste heat, that’s 100 million joules every second leaving the facility. A circle with a 1.6 km radius around the data center would have an area of about 8 million square meters.
Imagine that every single watt of heat the data center produces somehow makes it to the ground surface within that circle, spread perfectly evenly. None of it rises into the upper atmosphere. None of it blows beyond 1.6 km. Every joule goes straight into the ground. How much heating would each square meter of ground receive?
100,000,000 watts ÷ 8,000,000 m² ≈ 12.5 watts per square meter
Now, does 12.5 W/m² produce 1.5°C of surface warming? No, because the ground doesn’t just absorb heat and get hotter forever. As the surface warms, it loses heat faster, it radiates more infrared energy and sheds more heat into the air through convection. The surface will only warm until the extra heat loss matches the extra heat input, and then it stabilizes at a new temperature.
How quickly does the surface shed extra heat? Engineers quantify this with a “heat transfer coefficient” that measures how many watts per square meter the surface loses for each degree it warms. For outdoor surfaces with even a light breeze, this coefficient is at least 10-15 W/(m²°C), and often higher. This means that for every degree the surface warms, it loses an additional 10-15 watts from every square meter.
So to hold the surface 1.5°C warmer than it would otherwise be, you need to deliver:
1.5°C × 10 W/(m²·°C) = 15 W/m² (using the most favorable coefficient)
or
1.5°C × 15 W/(m²·°C) = 22.5 W/m² (using a more typical value)
Our absolute ceiling of 12.5 W/m², which already assumed 100% of the data center’s heat reaches the ground, falls short of even the most favorable estimate of what’s needed. And in reality, the vast majority of the heat rises, disperses, and never reaches the ground surface within 1.6 km. A generous estimate for daytime conditions would be that 2-5% of the data center’s total heat output reaches the ground surface within 1.6 km. That gives us:
12.5 W/m² × 0.02 to 0.05 = 0.25 to 0.625 W/m²
Which would produce a surface temperature increase of:
0.25 to 0.625 ÷ 12.5 = 0.02 to 0.05°C
That’s roughly 1-3% of the observed 1.5°C signal. And that’s for a data center way larger than average and almost no wind.
Conclusion of the math
Even if we assume that the average data center in this study was a 100 MW hyperscaler (which it definitely wasn’t, since the vast majority of the 11,000+ facilities in the study’s database are much smaller enterprise and colocation centers drawing closer to 10-20 MW), and the wind is always gentle, the math still doesn’t work for waste heat. With a 100 MW data center, only about 1-3% of the observed temperature increase could plausibly be attributed to waste heat warming the surrounding ground. The remaining 97-99% is explained simply by the building and its pavement being warmer than the grass they replaced, which raises the satellite’s blended average temperature reading without actually warming the surrounding land at all.
And 100 MW is an extremely generous assumption. The study’s database spans 2004-2024 and includes facilities of all sizes. A typical facility in this dataset likely draws 10-20 MW or less. At 20 MW, waste heat could account for less than 1% of the observed signal. In other words, for the actual average data center in this study, the temperature increase is almost entirely, over 99%, explained by the fact that a building exists where a field used to be. The ground around these data centers almost certainly hasn’t warmed in any meaningful way. The remaining temperature change to the land itself caused by heat exhaust from the data center is so tiny that it cannot have any meaningful effect on the ecology or human wellbeing in the region.
The one remaining question: why the clean step change?
There’s one aspect of this that’s still somewhat confusing and doesn’t square with my story. Look again at this graph:
This jump is somewhat significant. An average increase of 2°C is about 1/10-1/20th of the difference between grass and a building, but also we’re assuming the building is taking up a small part of the satellite image. It is weird that this jump doesn’t occur until after the data center becomes operational. If this were construction, you’d maybe expect more of a slow gradual curve up?
The strength of the other evidence leads me to suspect that something’s off here. There’s no smoking gun, but I have a few explanations for what might be happening:
The stuff that creates the large majority of the building’s new hot surface area is usually added at the very end of construction: roofs and parking lots. It would make sense to me that during construction a roofless building where the ground hadn’t been paved wouldn’t become as hot as a building with a full roof and large paved parking lot. If these are added in the last month and add the major part of the heat, it would appear like a step change. But this could be wrong.Some people who know more about architecture than me reached out to say the roofs are likely not what’s causing this, they’re often cooler than the construction site. I’m kind of at a loss here, could this be the parking lot? It’s hard to find reliable data on which parts of construction absorb the most heat. I need good sources on this but can’t find many. If you have tips, send them!The authors say they are measuring temperature changes relative to when each data center became “operational,” but that may be much less precise than it sounds. They don’t seem to know if operational here means “first server energized,” “first meaningful IT load,” “certificate of occupancy,” “roof completion,” or “substantial completion.” They’re just using a database date from the IEA-linked source they cite, and then centering all of their analysis on that single date. It would make sense to me that a lot of what’s listed in the data base might just be when the data centers wrapped up construction, which would align with when the roof and parking lot were added. The database they say was provided to them by IEA isn’t publicly available, so I have no way to check this. Data Center Map, the largest collection of public info on data centers online, says they track data center lifecycle stages including Land Banked, Planned, Under Construction, and Operational, but then immediately warns that these lifecycle stages “should only be considered indicative, as it is very hard to track when stages change.” If data center map considers its own data on this to be very hard to actually pin down, I’d suspect that IEA doesn’t have a significantly better private collection of all 11,000 data centers.
So my best guess is that the actual operational opening time varies a lot compared to the numbers the researchers are using, there’s going to be a clear jump in heat around the time the roof and parking lot are built, (←I’m now convinced that crossed out part’s wrong and this graph is a deep mystery to me) and therefore it’s likely that if you’re just looking at month by month snapshots, the roof + parking lot jump might appear to occur after the data center “became operational.”
One other important point is that this step change actually doesn’t look like what you’d expect to result from a data center’s energy draw, because most data centers are opened and then slowly filled with servers and powered on more and more over a period of months or even years. If this were the result of emitting more heat, you would expect the line to continue to go up and up as the data centers drew more power, but the actual average line appears to be flat after only a month of operations. The entire industry's ramp-up pattern is gradual, not instantaneous, at every scale, even for smaller colocation (not hyperscaler) data centers.
Data centers also vary enormously in their power draw, but the error bars where almost all observed heating effects occur are incredibly tight along a narrow band. I would expect any heating caused by data center power consumption to vary as much as the power consumption does itself, but this graph doesn’t show that at all. Instead, regardless of the size, data centers seem to have mostly shockingly similar effects on warming. Again, this is a sign that it’s the full physical infrastructure buildout of data centers and the stuff around them that might be causing this instead, though obviously data center physical size also varies a lot. This one’s very confusing in general.
I’m unsure here so will circle back if I get better evidence.
Other candidates for warming land
I would be pretty shocked to find out that the heating exhaust is able to warm the land this much after all this converging evidence, but my building explanation isn’t super satisfying as an explanation of the step change mentioned above. Other candidates for ways the data center could actually be warming land include:
Groundwater and irrigation changes. Data center construction often involves significant grading, drainage modification, and sometimes groundwater pumping. If the local water table drops or irrigation patterns shift in surrounding agricultural land, vegetation dries out and LST rises. This could plausibly create a gradient extending several km, especially in arid or semi-arid regions where many data centers are built. Would be interesting if this were about water use, though I think this is pretty unlikely as there are a few aspects of water that don’t fit the patterns we’re seeing here.
Vegetation stress from construction dust and runoff. During and after construction, dust deposition and altered drainage can stress vegetation in a radius around the site. Stressed or sparse vegetation has higher LST. This is temporary but could persist for years if the site continues expanding.
A statistical artifact from MODIS point spread function. MODIS doesn’t have a perfectly sharp pixel boundary, its effective spatial response bleeds signal from bright/hot pixels into adjacent ones. A very hot data center pixel could artificially elevate apparent LST in neighboring pixels purely as an instrument artifact. This would produce a smooth radial decay that has nothing to do with actual ground temperature. MODIS was designed for global-scale monitoring rather than facility-level analysis, so this could maybe be a nontrivial contributor.
The incredibly shifty framing the authors use
Over 99% of the observed land temperature increase seems to be coming from an omission in the author’s methodology. They’re assuming the land has warmed, but it hasn’t, and they’re only observing that there are additional warm buildings in the areas they are analyzing. They did not control for this at all and don’t even reference it as a possibility.
The authors strongly imply multiple times that the causal mechanism for this temperature rise is the high energy usage of the data centers. Here’s every time they imply that the effect here is due to heat emissions caused by high energy usage:
Title: “The data heat island effect: quantifying the impact of AI data centers in a warming world”
This frames the phenomenon as caused by AI data centers specifically, not by construction or land development. A better title would be “quantifying the impact of large buildings.”
Abstract: “we focus our attention on the heat dissipation of AI hyperscalers”
Explicitly names heat dissipation from operations as the focus of the paper.
Abstract: “the land surface temperature increases by 2°C on average after the start of operations of an AI data centre”
“after the start of operations” implies the operations are causing it, not the construction.
Introduction: “the type of human activities established and operating dramatically influence the impact of UHI on environment and communities”
Frames the effect in terms of activities operating, not buildings existing.
Introduction: “data centres are expected to be one of the most power-hungry activity in the next decade”
Connects the phenomenon to power consumption.
Introduction: “AI data centres are in vast majority relying on fossil fuel use”
Connects to energy source and emissions, implying operational energy is the driver.
Introduction: “the steep growth of AI training and use for various applications would directly translate into high net impact on emissions”
Links AI workload growth to environmental impact.
Introduction: “the inefficiencies and nonidealities of AI hyperscalers operations would cause their emissions to rise even more”
Again, operations.
Section 2: “This study relies on the assumption that AI hyperscalers might have an impact on the LST of their locations because of the heat that they would release as a result of the high power demanding applications that they would be used for”
This is the most explicit statement. The assumed mechanism is heat released by computational workloads.
Section 3: “These results are dramatically impressive, especially considering that the typical LST increase caused by the quintessential example of compound of anthropogenic activities – the urban heat island effect – has been estimated in the 4 and 6 °C interval”
Comparing to UHI, which is understood as an operational/activity-driven phenomenon.
Section 3, Bajío case study: “The stable climate, low seismic activity, and proximity to North American markets made the Bajío region a great hub for AI data centres. Nevertheless, it has been recorded a serious LST increase trend”
Implies the data center operations caused the regional warming. In fact, this region fits the Andy Masley theory of More Buildings = More Hot Buildings much much better. In addition to building some data centers over the last 20 years, the Bajío underwent one of the most dramatic industrial buildouts in Latin America. The region received $37.6 billion in accumulated foreign investment from 2004 to 2019, with nearly two-thirds going to manufacturing. While national industrial activity grew at 1.7% per year from 2003-2016, Bajío industry expanded at 4.6%. Toyota, Honda, General Motors, Bombardier Aerospace, and hundreds of other manufacturers built large-scale operations across the region. Industrial parks, automotive plants, logistics centers, highways, rail networks, and supporting commercial infrastructure were constructed at an enormous scale during the exact period the paper attributes its warming trend to data centers. The LST increase in the Bajío is far more plausibly explained by the massive conversion of agricultural and rural land to factory rooftops, warehouses, parking lots, and paved roads than by the waste heat of data centers. The paper sees “data centers + warming” and draws a causal arrow between them, while completely ignoring the fact that this region was transformed from an agricultural center into one of North America’s most important manufacturing corridors during the same period.
Section 3, Aragón case study: “The region is becoming a critical node for AI, cloud computing, and, increasingly, specialized server manufacturing. At the same time, the region has recorded an anomalous increase of approximately 2°C”.
Same story as Bajío, different country. Aragón has undergone a massive energy and industrial buildout during the study period. The region has become a multi-sectoral hub (from data centers to logistics and automotive) with companies like AWS, Microsoft, Blackstone, and others developing strategic projects there. In the last year alone, 651 new megawatts of wind and solar photovoltaic capacity were installed, a 7.1% increase over 2023. Aragón has been described as potentially the “Saudi Arabia of solar power in Europe” and bp alone has around 1.1 GW of solar projects at various stages of development or construction in Aragón. A single solar cluster near Zaragoza installed 615,000 bifacial solar panels across 650 hectares of land, with two overhead transmission lines of 18 km and 20 km constructed to connect it to the grid. That’s hundreds of hectares of dark solar panels, wind turbines, substations, transmission infrastructure, access roads, and associated industrial development blanketing a previously rural, sparsely populated region, exactly the kind of massive land cover change that would produce a clear LST increase when viewed from a satellite. The paper attributes the warming to data centers and ignores all of this. The Andy Masley theory of Buildings are Hotter than Grass is more parsimonious with the data.
Section 4: The entire mitigation section proposes solutions to reduce operational energy consumption: more efficient algorithms, adiabatic circuits, model pruning, dynamic power response. These are solutions to “servers produce too much heat,” not solutions to “a building was constructed and is hotter than grass.”
Section 5: “We focus our attention on the heat dissipation of data centres, which is directly connected to the energy consumption required for the operations of the AI hyperscalers”
Explicitly links the effect to operational energy consumption.
Section 5: “Since the trends of data centre energy consumption are expected to show a steep growth in the foreseeable future, the data heat island effect could solidly become an additional factor for environmental and industrial sustainability”
Implies the effect will worsen as energy consumption grows, which only makes sense if operations are the cause. If it were land cover change, the effect would be determined by building footprint, not energy consumption.
The paper also repeats the claim over and over that 343 million people are “affected” by the data heat island effect. They find this by just counting everyone who lives within 10 km of a data center in the study’s database. They don’t bother to see whether those people experienced anything bad at all, like a change in air temperature, health outcomes, energy costs, or anything else. By the same methodology, you could count everyone living within 10 km of a Walmart and announce that billions of people are “affected” by the Walmart being a hot building regardless of whether it’s affecting anything else. In reality, I think 343 million people are being affected by the “If you build a building the building gets hot in the sun and doesn’t really affect anything else” effect.
Another incredibly shifty move the authors make is using "AI hyperscalers" and "AI data centres" throughout the paper, but the database they use (from the IEA) contains data centers of all types. Most data centers built between 2004 and 2024 weren't doing AI workloads at all, especially in the earlier years. The framing makes it sound like this is about AI specifically, but almost all of what they’re measuring is traditional non-AI focused data centers. It’s incredibly jarring to read “across all AI hyperscalers analysed during the 2004-2024 period” as someone who knows anything about the timing of the data center buildout. AI-focused hyperscaler data centers didn’t appear until after 2020.
I don’t understand the sociology of how something like this gets published. These are serious people! Going down the list of authors:
The lead author Andrea Marinoni is an associate professor of applied remote sensing at the Arctic University of Norway with a visiting fellowship at Cambridge.
Benjamin Horton is the Director of the Earth Observatory of Singapore at Nanyang Technological University, a leading sea-level rise researcher, IPCC author, Fellow of both the American Geophysical Union and Geological Society of America, and winner of the EGU Plinius Medal. His research was cited by President Obama in the 2015 State of the Union Address. He has 260+ peer-reviewed publications including in Science, Nature, and PNAS. He’s a very serious climate scientist!
Erik Cambria is a Professor of AI at NTU, IEEE Fellow, Visiting Professor at MIT Media Lab, Provost Chair in Computer Science, 80,000+ citations on Google Scholar, listed in Clarivate’s top 1% of scientists, and was featured in Forbes as one of “5 People Building Our AI Future.”
Pietro Lio’ is a well-known computational biology and AI researcher at Cambridge.
Jocelyn Chanussot is a prominent remote sensing researcher at Université Grenoble Alpes, IEEE Fellow, with expertise in signal/image processing for remote sensing. He’s arguably the author whose expertise is most relevant to the methodology.
What happened here?
The media is already running with this
Despite this paper not being peer reviewed and only being up on arXiv for 10 days, the media is already running with it.
CNN: Scientists have found an alarming environmental impact of vast data centers
CNN adds that data centers are “ making life hotter for more than 340 million people.” They also add “The findings are particularly alarming, the scientists say, because AI data centers are set to boom over the next few years, and these temperature rises come as planet-warming pollution is already making heat waves more extreme around the world.” This is so incredibly deceptive. This study told us nothing about heating air. “Already making heat waves more extreme” paints a picture of people’s lives getting warmer as a result of this effect.
There were also a lot of local CNN affiliates that ran copies of the story, like here and here and here.
Benton Institute for Broadband & Society: "AI data centers can warm surrounding areas by up to 9.1 degrees Celsius"
WHAT?! They ran with the absolute craziest outlier in their headline?!
Bode Living: “AI Data Centers Are Generating Significant Local Heat, Study Reveals”
New Scientist shares this story on their social media feed
What is going on with the media ecosystem around data centers? It’s crazy. The average person’s understanding of AI has already been wildly warped by bizarre obviously wrong coverage of data centers over and over. I’d like to make sure more new crazy wrong ideas don’t seep into the public’s beliefs. I want to stop this one from escaping containment if I can.
A parting thought: AI is useful for research
This paper didn’t pass the sniff test for me when I first read it. The first thing I did when I saw it was upload it to Claude and ask it for anything that seemed off about the methodology. Claude responded like this:
This paper has some pretty significant methodological problems. Let me walk through the main issues.
The core identification problem is fatal. The paper’s entire causal claim rests on showing that LST rises ~2°C after a data center begins operations. But they’re measuring land surface temperature at 500m resolution from MODIS satellite data — and what happens when you build a data center? You replace vegetation or bare soil with a large dark-roofed building, parking lots, and paved access roads. That land use change alone would produce exactly the LST signature they observe, completely independent of waste heat. They’ve essentially rediscovered that buildings are warmer than fields when viewed from space. LST measures the radiative temperature of the surface itself, not ambient air temperature, so a rooftop baking in the sun will read dramatically hotter than the grass it replaced. They never attempt to distinguish this from actual thermal pollution.
No control group. A basic difference-in-differences design would compare data center sites to similar sites where, say, a warehouse or distribution center was built instead. They don’t do this. Any large commercial construction project — an Amazon fulfillment center, a Walmart, a factory — would likely show a similar LST step-change. Without controls, they can’t attribute anything specifically to data centers’ operational heat output versus generic land development.
The spatial decay curve is suspicious in the wrong direction. They find the effect “reaches up to 10 km” and drops to ~30% at 7 km. But think about what actual waste heat dissipation looks like: data centers exhaust warm air that mixes rapidly with ambient air. The thermal plume from even a large facility would be negligible beyond a few hundred meters in terms of measurable air temperature change. A 10 km radius of influence would require an implausible amount of heat. What would produce a gradually decaying LST signal over kilometers? The ancillary development (roads, commercial buildings, housing) that tends to cluster around data center campuses. They’re likely picking up the general suburbanization/industrialization footprint.
The 2°C figure is misleadingly framed. They compare their 2°C LST increase to the urban heat island effect’s 4-6°C range as if these are comparable phenomena, but UHI studies typically measure ambient air temperature differences (or at least carefully distinguish LST from air temperature). A 2°C LST increase in a single MODIS pixel that went from grassland to a commercial roof is trivially explained and tells you almost nothing about whether nearby residents are experiencing warmer temperatures.
The 343 million affected people claim is essentially meaningless. They count everyone living within 10 km of any data center globally and associate them with whatever LST change was observed. But they haven’t shown that these people actually experience any temperature change. LST at a data center rooftop doesn’t translate to air temperature in a neighborhood 5 km away. The population figure is just “people who live somewhat near data centers,” repackaged as an impact metric.
The case studies are cherry-picked and don’t support the argument. They mention the Bajío region in Mexico, Aragón in Spain, and Ceará/Piauí in Brazil as places with “anomalous” warming trends that coincide with data center presence. But these are regions with well-documented climate trends driven by broader factors — land use change from agriculture, deforestation, urbanization, and regional climate variability. Pointing at regions that have both data centers and warming trends, without controlling for anything else, is textbook confounding.
They conflate “AI hyperscalers” with generic data centers. The paper uses “AI hyperscalers” and “AI data centres” throughout, but the database they use (from the IEA) contains data centers of all types — colocation facilities, enterprise data centers, telecom facilities. Most data centers built between 2004 and 2024 weren’t doing AI workloads at all, especially in the earlier years. The framing makes it sound like this is about AI specifically when their data can’t support that distinction.
The seasonality removal and filtering methodology is underspecified. They mention removing seasonality and outliers but don’t describe how. With 500m MODIS LST data, cloud contamination, emissivity variations by land cover type, and viewing angle effects are all serious issues. The paper doesn’t discuss any of these, and “aggregating to monthly scale” doesn’t solve them — it just smooths over them.
The “step function” in Figure 2 could easily be an artifact of construction timing. If the “start of operations” date is close to when the building was physically completed, then the step change in LST simply marks when a large impervious surface appeared in the satellite’s field of view. You’d expect exactly this kind of abrupt transition regardless of whether the servers inside were even turned on.
The mitigation section is a grab bag that undermines the paper’s seriousness. They pivot from their empirical findings to discussing adiabatic circuits, model pruning, carbon-aware inference, passive radiative cooling coatings, and a “Matryoshka model of intelligence” — a philosophical framework by one of the coauthors. None of this connects rigorously to their findings. It reads more like a literature review of the authors’ other work than a coherent response to the specific problem they’ve identified.
Fundamentally, this paper presents a land-use-change signal as a climate impact finding. A rigorous version of this study would need to measure actual ambient air temperature effects (not just LST), include matched control sites, and disentangle construction from operations — and it would likely find a much smaller and more localized effect.
I didn’t rely on any of this being true. I did a deep dive on each to see if it held up and came up with additional arguments (like the math for how much energy the ground could take in), but ultimately I knew most of the issues with this paper within about a minute of uploading it to an AI chatbot, and major news organizations like CNN apparently missed these. My skills at finding these errors have in large part been automated away and you can download the same skills by using Claude or ChatGPT or Gemini. I claim that this is strong evidence that AI is, in fact, sometimes useful for research.
Thank you for spending the time to write this when most sensible people would just go "It's obviously stupid" and ignore it. If it weren't for people like you, it would go unchallenged.
The before/after pics of the Bajio industrial park from Google Earth are crazy and like 2% of it is data centers and the other 98% of it is car parts.